¶ Audience Insights for Facebook
In this article, we will learn how to understand audience insights dashboard & action items for Facebook Campaigns.
Audience Insights is a feature that provides actionable insights and data analysis for your Ad account generated by Pixis AI. These insights help you understand audience behavior, optimize performance, refine targeting, measure ROI, identify trends, and enhance creative strategies.
¶ Before we begin
-
You need to request smart insights for your Ad account.
¶ Audience Insights filters
You can use the below filters to identify your target audience:
-
Select the Ad account: Select the Ad account for which you want to view the insights.
-
Select Review Period: You can select from predefined time frames, such as the past 1 month or the past 6 months. This allows you to view data insights over a period that fits your analysis needs.
-
Select Event: Select the event you want to check insights for. Whether it's tracking leads, purchases, or other events that you’re tracking via Pixel or app events, this filter helps you focus on the specific data relevant to those key actions.
The insights are generated on the every 1st of month

¶ Category Wise Breakdown
In this section, you can understand the audience breakdown according to interests, behaviour, and demographics. The audience priority score reflects the category you should choose.
-
Dimensions: These are different categories your audience is interested in.
-
Custom Audience Size %: The percentage of the custom audience in a demographic region who are interested in/belong to a particular dimension.
-
Overall Audience Size %: Percentage of audience in a demographic region who are interested/belong in a particular dimension
-
Audience Priority: When calculating Audience Priority, we take into account the difference between the percentage of the custom audience size and the overall audience size. A higher Audience Priority means the targeting is more relevant.

You can filter parent categories to display specific dimensions. For example, selecting the Business and Industry category will show only the related dimensions, such as Investment, Business, and Real Estate.

¶ Uniqueness graph
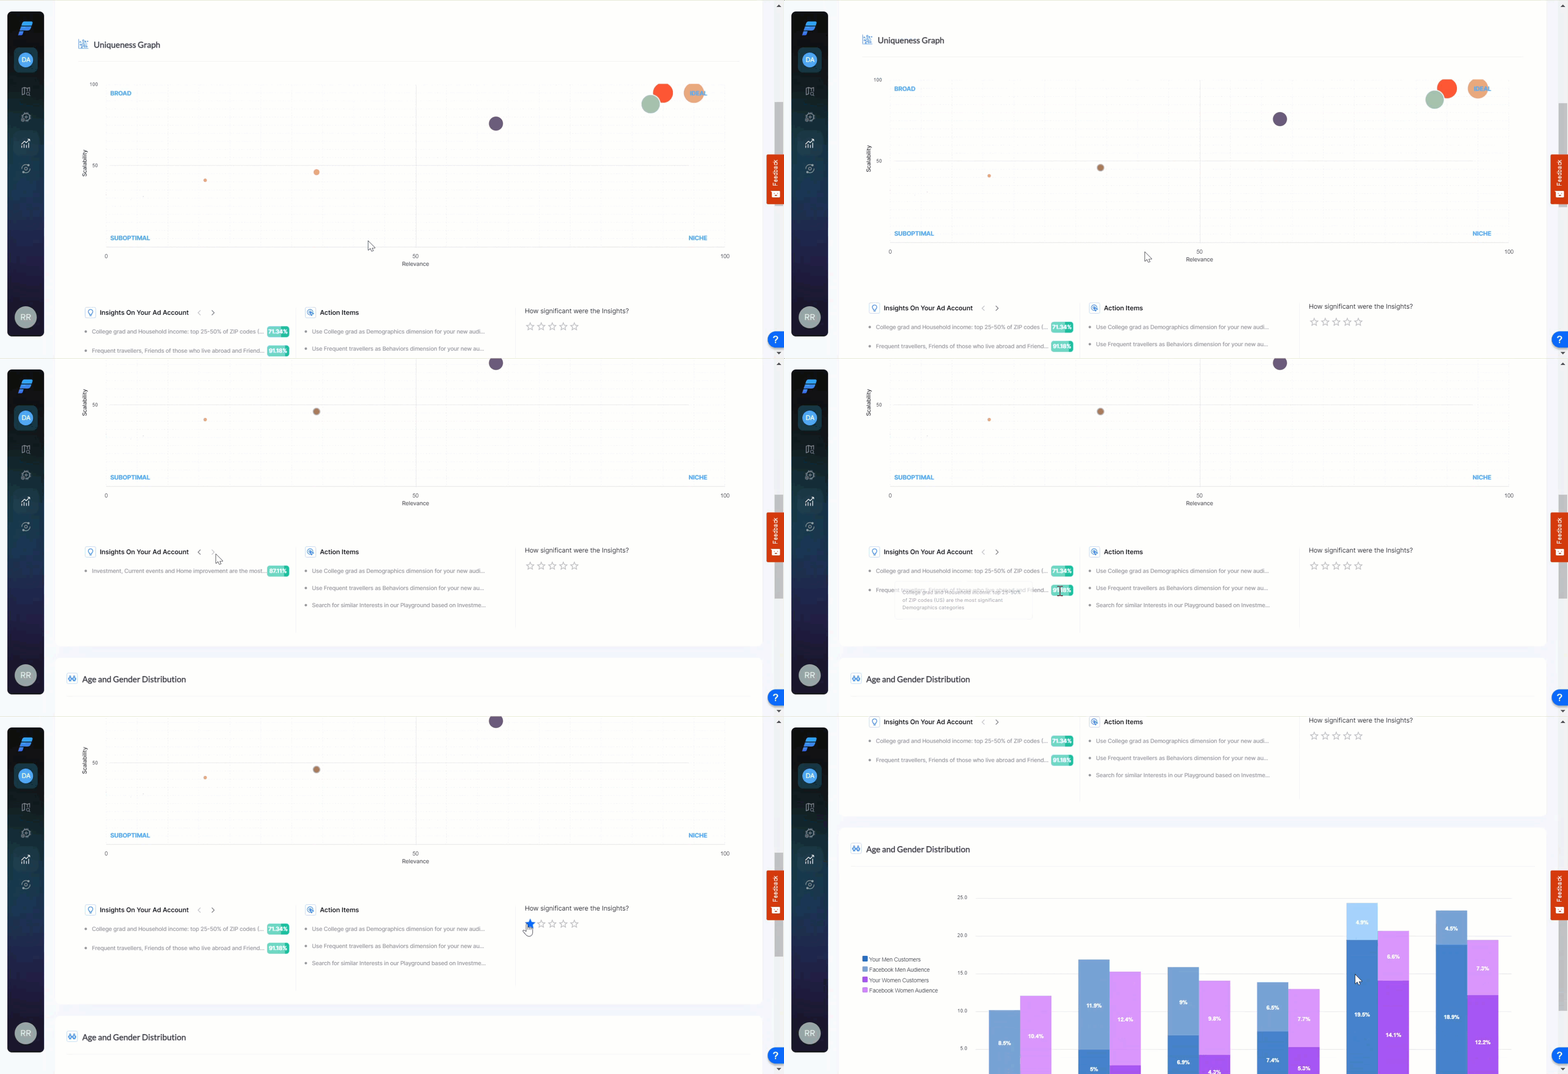
This graph illustrates the scalability and relevance of specific dimensions or interests within your audience segments. Each bubble represents a unique audience segment, and its size indicates the segment's volume. The graph is divided into four sections: Broad, Ideal, Suboptimal, and Niche.
-
Broad: The Broad section contains segments with a large volume but lower relevance to your campaign objectives. These are general audiences that might not yield the best return on investment.
-
Ideal: The Ideal section is where you want to focus your efforts. Segments here are both highly relevant and scalable, offering the best potential for achieving your marketing goals.
-
Suboptimal: The Suboptimal section includes segments that are less effective. These segments are neither large in volume nor highly relevant, and they might not be the best use of your marketing resources.
-
Niche: Lastly, the Niche section contains small but highly relevant segments. While these audiences are limited in size, they can still offer valuable opportunities for highly targeted campaigns.

¶ Age and Gender distribution
This chart provides a comprehensive breakdown of your audience based on age groups and gender. It is a valuable tool for understanding your audience’s demographic composition. It helps you pinpoint which age and gender groups are most engaged with your campaigns, enabling you to refine your marketing strategies effectively.

¶ Insights on your Ad account
This feature provides automated, data-driven recommendations to help you optimize your marketing campaigns based on the selected Review Period. These insights are generated by analyzing your campaign data, identifying trends, and pinpointing areas for improvement. The recommendations are designed to enhance the effectiveness of your advertising efforts. For instance, suppose one of the insights indicates that 'Shifting 15% of your budget from Campaign A to Campaign B could increase overall conversion rates by 10%. This suggestion is based on the observed higher performance of Campaign B compared to Campaign A.

¶ Action Items
This feature provides a list of actionable tasks derived from the insights and data analysis of your ad account. These tasks are designed to help you implement the recommendations quickly and efficiently. For instance, any action item might suggest reallocating 15% of the budget from Campaign A to Campaign B,' reflecting the insight that Campaign B is performing better and could yield higher returns with additional investment.

¶ How significant were the insights?
Here, you can rate the insights using a simple feedback system. Each insight can be evaluated based on its usefulness and significance to your campaign. Your feedback is crucial as it helps improve the accuracy and relevance of future insights.
