¶ Ad Strength Analysis
The Ad Strength Analysis section provides detailed insights into the performance and strength of Google search ads for the selected ad account. This section includes interactive charts and tables that help you understand how well your ads are performing based on various metrics. The dashboard helps you:
-
Comparative Analysis: Use the Month-over-Month Analysis to observe trends over time.
-
Performance Metrics: Focus on Metrics vs. Ad Strength to evaluate which campaigns yield the highest returns.
-
Detailed Review: Leverage the ad strength table for a granular analysis of each campaign.

Here’s a breakdown for the following section of the dashboard:
-
Month-over-Month Analysis
-
Metrics vs. Ad Strength Analysis
-
List of ads and their strength
¶ Month-over-Month Analysis
This chart displays the number of ads distributed by their strength category (AVERAGE & POOR) over different months. For example, if January shows 13 as AVERAGE and 122 as POOR, this indicates that most ads performed poorly with a large portion underperforming.

¶ Metrics vs. Ad Strength Analysis
This section includes a set of charts and tables providing deeper insights into ad performance metrics relative to ad strength.

¶ Breakdown:
-
Ad Count & Spend Distribution by Ad Strength: Displays the total ad count and spend across different ad strength categories.
-
For Example: If GOOD ads have a higher bar than POOR, it indicates more ads are performing well, and more budget is allocated to these ads.
-
-
Cost & CPC by Ad Strength: Shows the total cost and Cost-per-Click (CPC) for different ad strengths.
-
Example: A higher bar for GOOD ads under CPC would mean these ads cost less per click compared to POOR ads.
-
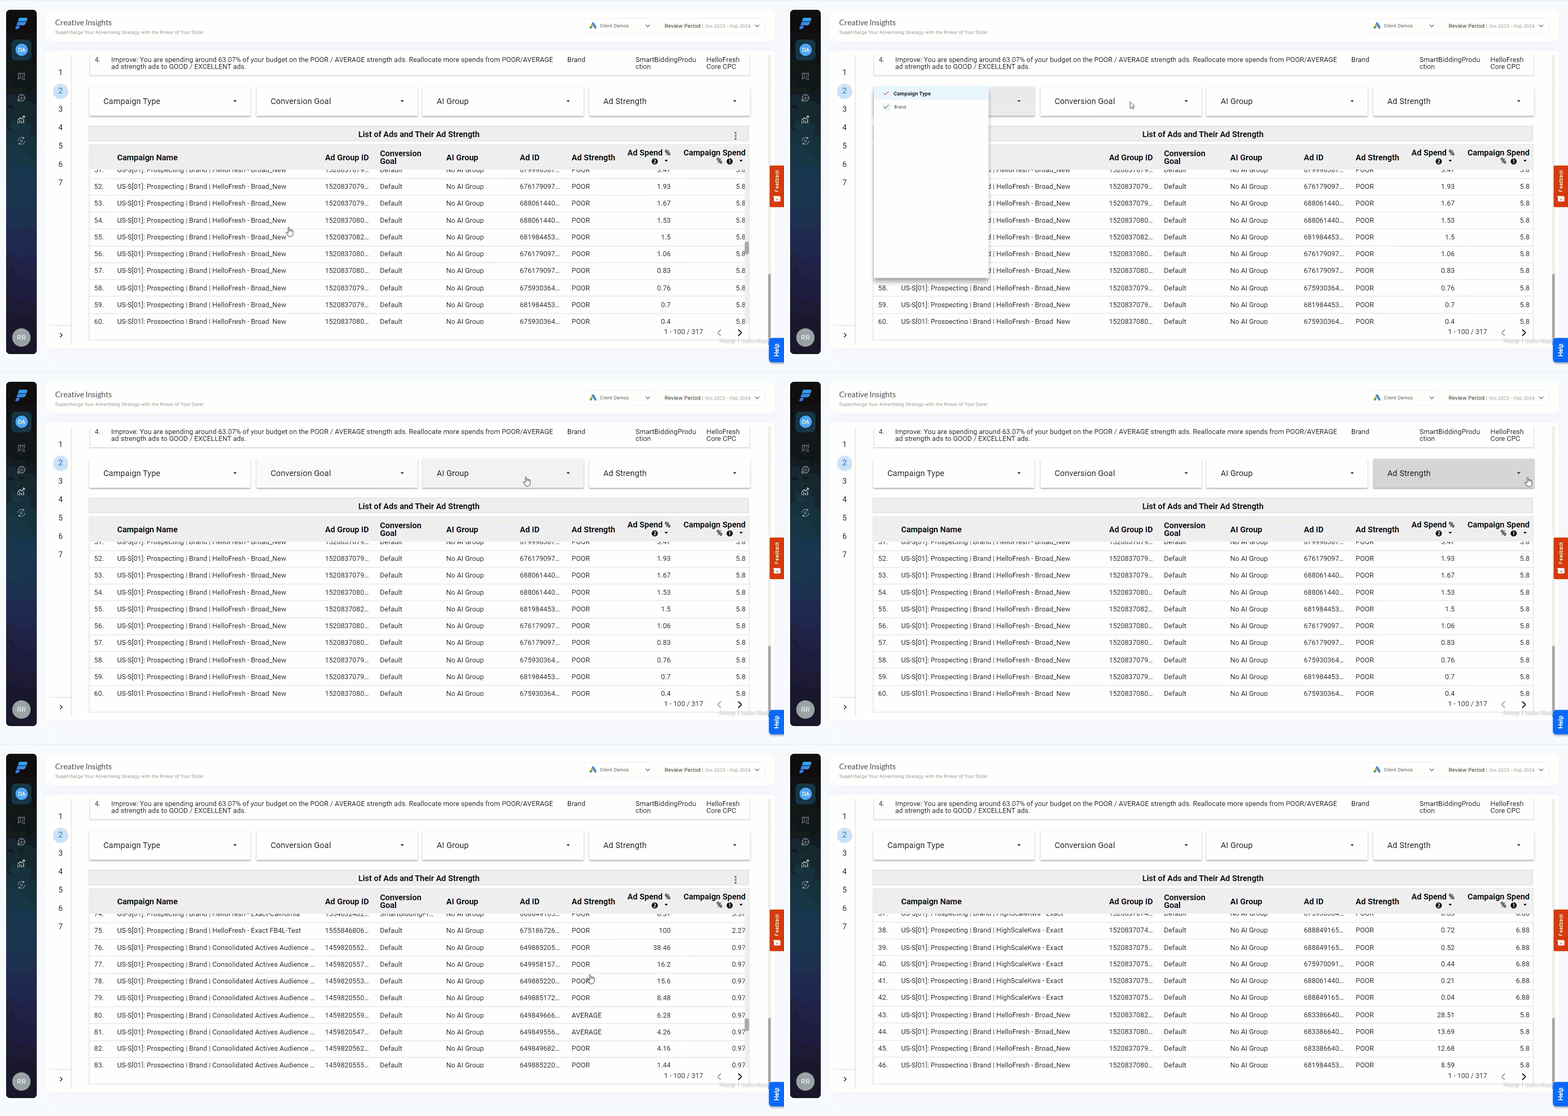
¶ List of Ads and their Strength
This section provides a summary of the key findings from the charts and tables, offering actionable insights for you. By reviewing these metrics, you can identify which campaigns and ad strengths are performing best and allocate resources accordingly.
¶ Data Table:
The bottom table lists detailed metrics for each campaign, including:
-
Campaign Name: Name of the campaign.
-
Dates: Active dates for the campaign.
-
AI Group: A group of campaigns that represent the same objectives.
-
Ad Strength: Rating (GOOD, AVERAGE, POOR).
-
Spend: The amount spent.
-
Conversions: The number of conversions.
-
Conversion Rate: Percentage of conversions.
-
CPC: Cost-per-Click.
-
CPM: Cost-per-Thousand Impressions.
¶ Example:
-
Campaign Name: "Spring Sale"
-
Ad Strength: GOOD
-
Conversions: 120
-
CPC: $0.50
